Large-Scale YouTube On-Device Survey
Understanding Why Viewers Don’t Sign In to the YouTube app on TV
Role: UX Researcher for YouTube
UX Research Project Lead:
UX Research Team:
Katie Belleville, Natalie Johnston
Product Team:
Ben Kendall
Engineering Team:
Yiwen Zhang, Ashish Deshpande, Eugene Goldin
Design Team:
Ritwik Amol Deshpande
Client:
YouTube is the world’s largest online video sharing platform owned by Google. The YouTube Living Room Team specifically focuses on the YouTube app on the TV, and frequently collaborates and aligns with other YouTube teams such as Mobile and Web, Music, Youth, and Premium, as well as other TV-focused teams such as GTV. The YouTube Living Room User Research Team has different divisions assigned to each researcher: Search and Discovery, Identity and Connected Experiences, Watch and Shorts, and Creator experiences.
One of YouTube’s goals for the year was to drive specific company metrics to increase sign in on the YouTube app on the TV. Leadership wanted to understand why some viewers use YouTube signed out (also known as the Guest account), in order to address any issues around sign in and find new ways to drive the sign in rate on the TV.
The large-scale on-device survey was launched starting December 2024 through March 2025 across 8,386 devices signed out of the YouTube app on the TV in the US, India, and Germany in 3 languages (American English, India English, and German).
Survey Methodology Decisions
Survey on the YouTube app on the TV vs. other survey options. Since the main criteria for respondents was that they needed to be users who watch YouTube on the TV signed out, the survey needed to be shown on the device and at the time that the signed out (Guest) account was selected to ensure the right type of respondent responded to the survey. Using the YouTube app on the TV HaTS program allowed engineers to specifically target users from the backend (even though a HaTS wasn’t technically the type of survey that was run). In addition to this, a previous research study found that participants didn’t fully understand that the Guest account and signed out account were the same, which may make surveying participants outside of the experience about their signed out status more inaccurate. Other surveying tools within and outside of Google were also found to be inadequate for the project needs.
Survey Response Collection and Refinement. Survey responses were created by looking through all previous identity-related research, and possible responses were compiled into a single spreadsheet. From there, the UX Researcher usually in charge of the Identity work stream and I went through to make cuts and modifications to the responses, revising those that would cause triggers for the legal team, are areas YouTube teams would not make changes to despite the findings, and which don’t follow survey best practices (such as non-exclusivity of responses shown). The different responses were also checked for reading level and revised from those findings.
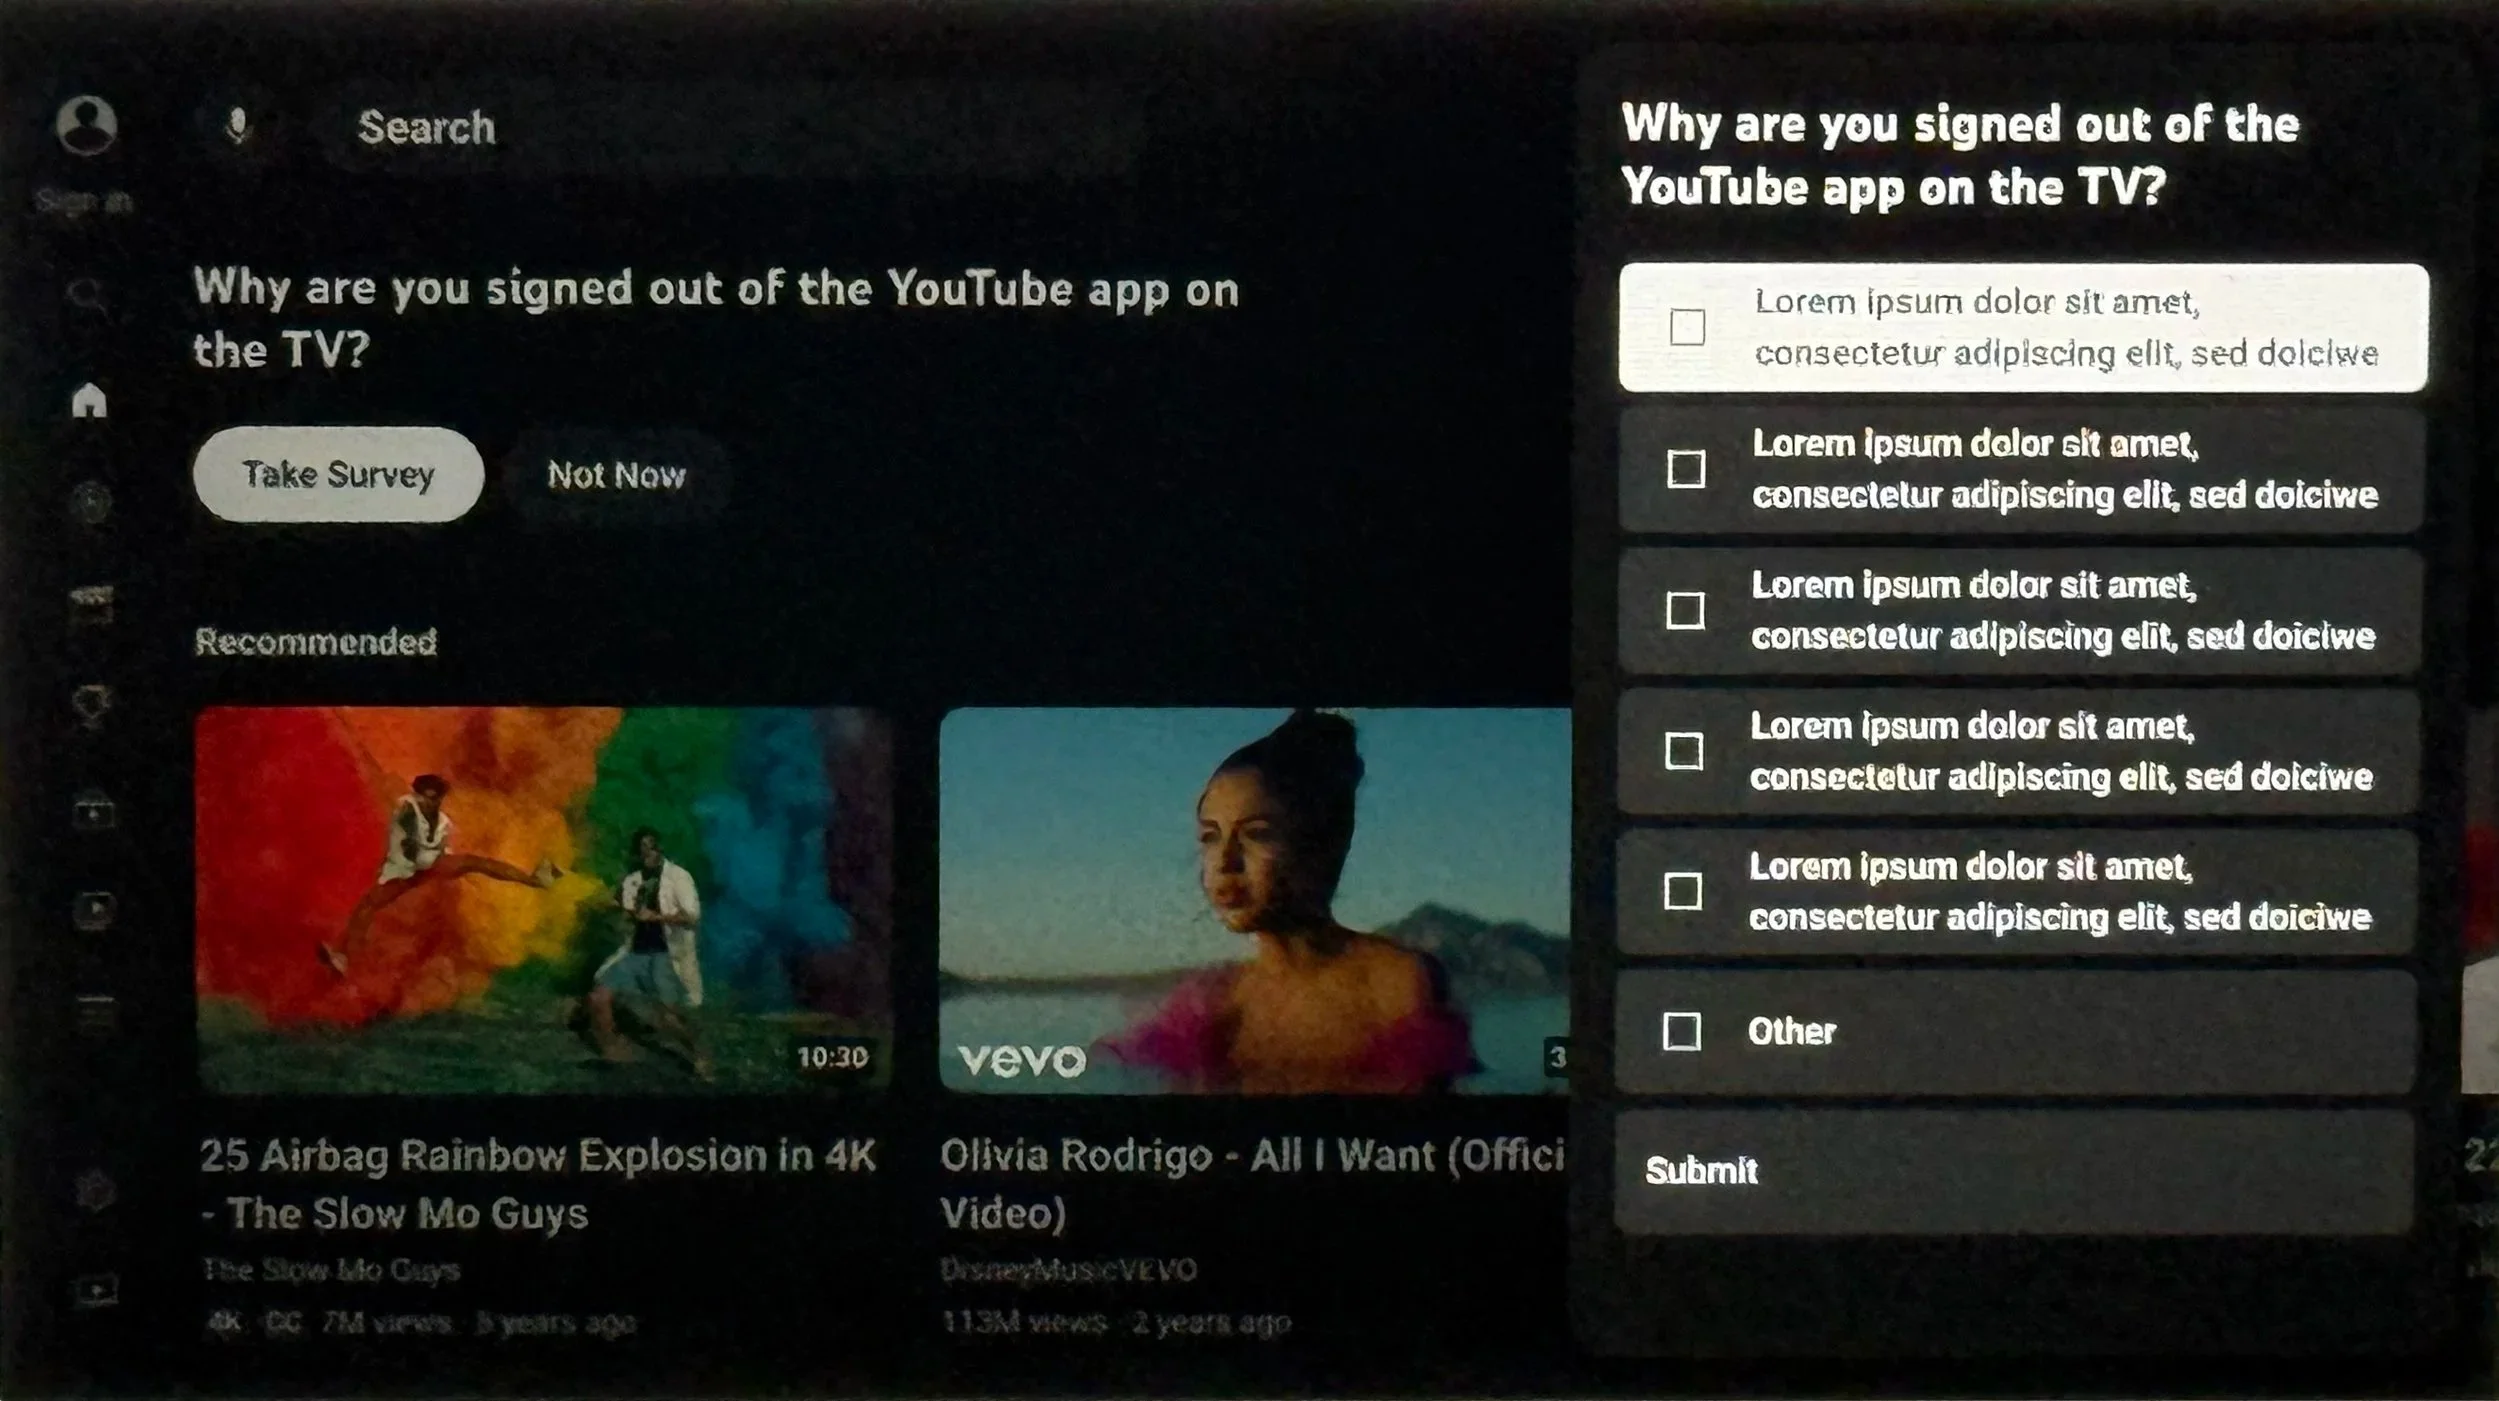
Number of Response Options to Include. 27 different mutually exclusive response options were included in the survey. While this drove up the total number of responses that needed to be returned, I worked with the rest of the UX research team to determine that there was a chance that this would be the only survey about signed out accounts that they would launch in the next number of years, it made more sense to be be as thorough as possible rather than trim to s subset of options to reduce the target sample size. Since the YouTube app on TV UI only had space to show 6 options at a time, I worked with the Engineering team to randomly display 5 survey response options per device, plus the options to choose “Other" (all survey responses would be shown an equal number of times across the different phases of research).
Single-Select vs. Multiple Choice Survey Responses. Since the response options were mutually exclusive, there theoretically can be multiple reasons why a viewer would use the YouTube app on TV signed out, so the survey needed to be multi-select instead of single-select.
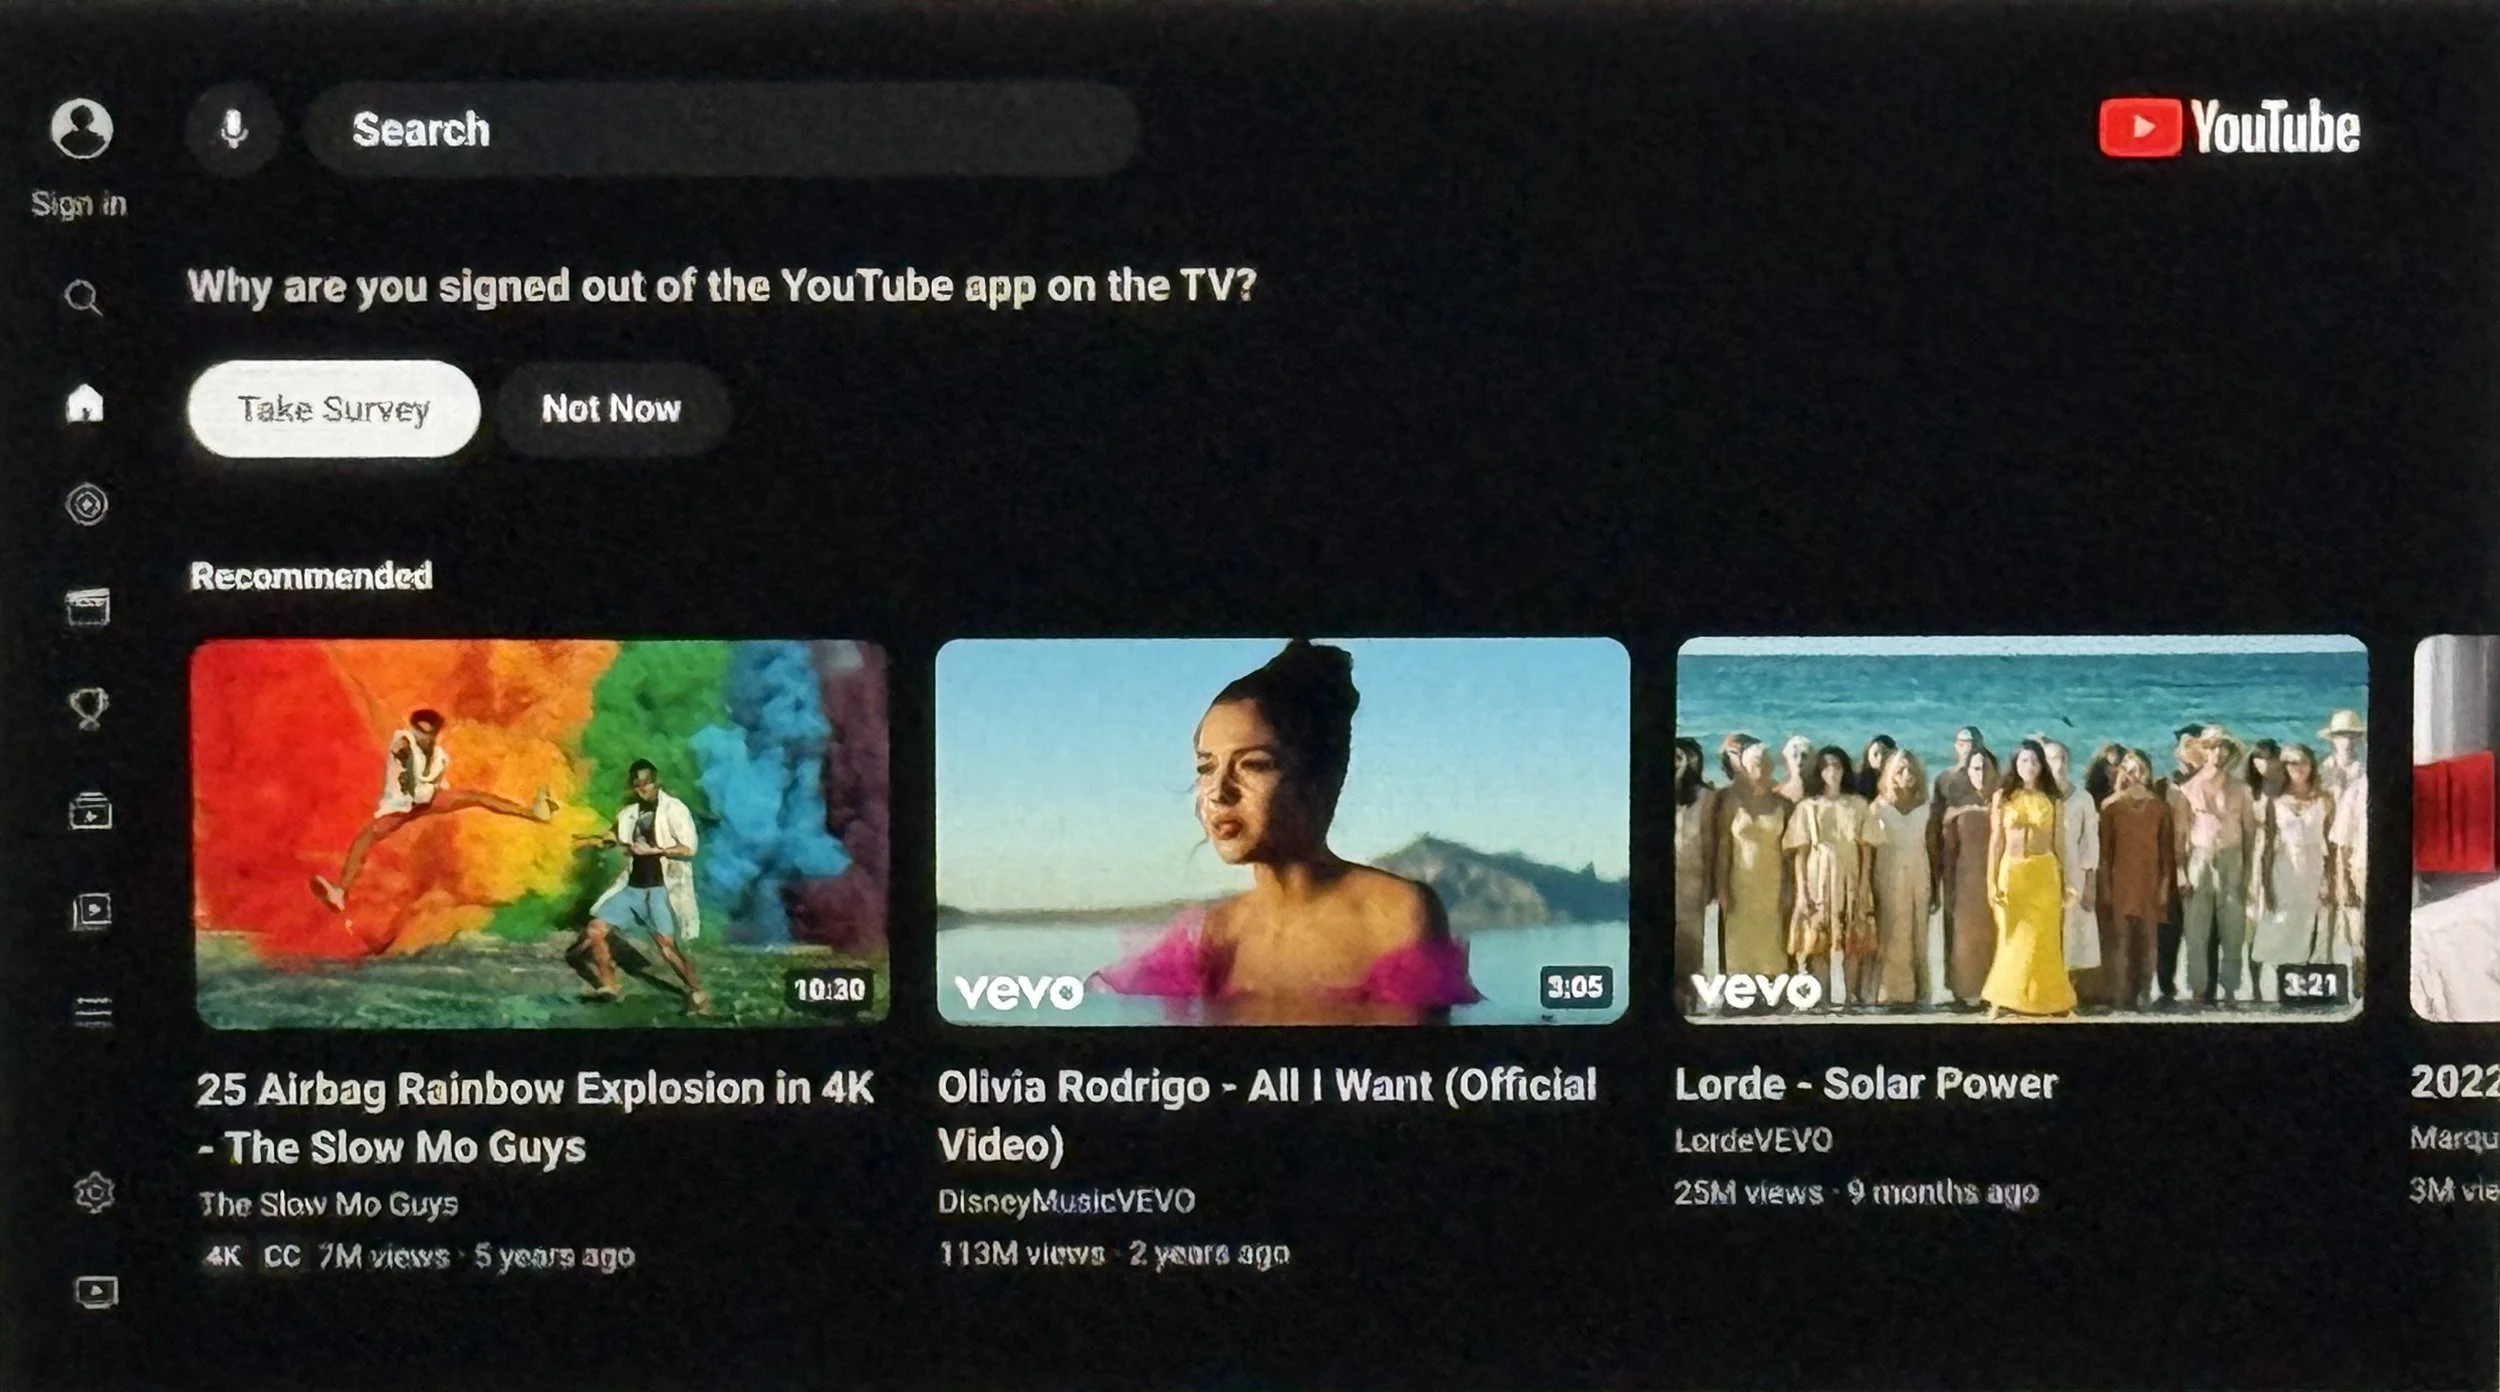
What to Count as a Survey Response. The survey is technically 2 parts, where the YouTube app on TV Home screen would show, “Why are you signed out of the YouTube app on the TV?” with 2 response options: “Take Survey” and “Not Now” (another negative response option here like “Dismiss” would enter the user into a quarantine state so the button needed to be changed. If “Take Survey” was selected, a sidesheet would open with the response options shown, and the side sheet could only be closed when at least one response was selected and “Submit” was pushed. Therefore, I decided to count a device shown the survey towards the “number of surveys to send out,” and a user selecting at least one response option and clicking on “Submit” counts as a response. A user clicking on “Take Survey” would not count towards any calculation.
Analysis of Findings in Aggregate/Cross-Country vs. per Country (Region). Due to the notable cultural, market, and economic differences between the US, India, and Germany, the initial plan was to have the findings analyzed by region, despite the fact that the survey questions and responses were translated into the most common language used on the YouTube app on TV for that region. However, looking at the actual survey findings, no major market differences were found, so the findings were analyzed in aggregate.
Survey Calculations and Launch Phases
Since the sample size calculation range for the whole project was so large (due to the population sizes of the different markets), the survey launch was divided into multiple phases. Initially, the study was planned to be conducted across 8 different regions, chosen because of their potential to produce different responses based on the region and strategic targets for YouTube.
Looking at the monthly active viewers (MAV) using the YouTube app on TV signed out for each region, with 27 different survey response options, with each response option being shown 1,000-2,000 times per region, and an estimated 3% response rate (based on a previous survey run with signed out users), the estimated number of surveys that needed to be sent out was 1,440,000-2,880,000 in order to reach 43,200-86,400 responses (!!!). This large sample size was a concern for the team that approved on-product survey launches for YouTube, so a multi-phase approach to try and cut down the total sample size was planned. Additionally, I met with the Product Manager to prioritize further which markets to combine, include, and exclude to try and reduce the sample size.
With 3 regions, US, India, and Germany, the estimated number of surveys to send out went down to 540,000-1,080,000 across the 3 regions and the number of responses reduced to 16,200-32,400.
Multi-Phase Survey Structure
Full Launch= Phase 1 + Phase 2
Phase 1: 10-20% of the Full Launch
Phase 2: Full Launch - Phase 1 - Adjustment
Full Launch Calculations
27 unique response optiona x 1,000-2,000 views per response option= 27,000-54,000 views of all response options per region
Since 5 response options at a time are shown in the on-device survey UI, 27,000-54,000 views of all response options per region, 27,000-54,000 divided by 5 = 5,400-10,800 views of the survey per region. Multiplied by all 3 regions is 16,200-32,400 views of the survey needed.
3% response rate is both the rule of thumb, and the general response rate of signed out users for this type of survey on YouTube. This is only used in estimate calculations, since signed out users may actually be less engaged with surveys than signed in users. Per region, 5,400-10,800 views are needed, so 5,400-10,800/0.03= 180,000-360,000 surveys need to be sent per region. For all 3 regions, this becomes 540,000-1,080,000 surveys that need to be sent.
From here, the target number of surveys need to be compared to the total number of monthly active viewers (MAV) per region to understand the likelihood that the number of responses needed would be returned. At the beginning of the study when there were more regions considered, it turned out that one region in particular couldn’t meet the numbers and so had to be combined with another region (then later discarded due to change in strategy). Across the US, India, and Germany, the minimum number of responses per region, 5,400, was a different percentage of each signed out population, but was stated in the research findings but not ruled as a blocker.
Phase 1 (Pilot Launch, 10-20% of Full Launch)
Phase 1 was intended to be used like a pilot to test the survey response quality itself and see where survey responses could be cut to lower the number of surveys that needed to be sent to devices. The plan was to pause the survey when each region reached at least 540 responses, and each randomized survey option was shown to users an estimated 100-400 times per region (10-20% of the full launch’s 1000-2000 times shown per region) (not including “Other”). Since response rate may vary by region, monitoring by the engineering team and UXR was crucial since some regions may need to be paused at different times. After the intended number of responses was collected, they would be sent to the UXR for review. If the data collected created inconclusive results, the survey may be turned on again for more data collection.
During the UXR review of the responses, the UXR would cut all of the lowest-selected response options (across all 3 regions, not the lowest per region) if the number of responses were different enough from each other.
*In practice, due to the length of time and amount of effort needed to run the survey (3+ months) and the direction of the survey findings, the survey was turned off at 8,386 responses across all 3 regions.
3 Regions:
US (American English)
India (India English)
Germany (German)
Number of surveys to send out (assuming 3% response rate, 100-400 views per region)
54,000-216,000 for 3 regions
18,000-72,000 per region
Number of responses
1,620-6,450 for 3 regions
540-2,160 per region
Phase 2 (Full Launch - Phase 1 - Adjustment)
Phase 2 would be run after Phase 1 if it was determined that more responses were needed to be analyzed to reach a conclusion. If the number of response options could be cut down from the Phase 1 findings, Phase 2 would be revised to exclude those.
3 Regions:
US (American English)
India (India English)
Germany (German)
Number of surveys to send out total (assuming 3% response rate)
540,000-1,080,000 for 3 regions (including what was covered in Phase 1)
180,000-360,000 per region (including what was covered in Phase 1)
Number of responses
16,200-32,400 for 3 regions (including what was covered in Phase 1)
5,400-10,800 per region (including what was covered in Phase 1)
Different calculations were covered using the above formulas to estimate if the 27 total responses could be reduced by 5, 10, etc. responses, and calculations redone to find the Adjustment.
Data Analysis and Research Findings Impact
Data was to be analyzed by region, device, and number of signed in accounts on the device (since there may be a difference in responses between devices that have only one account vs. multiple accounts).
Due to NDA, specific findings could not be shown here, but the study unearthed 3 different thematic areas to tackle to increase sign in, which drove strategic efforts for different teams across YouTube, including the Identity team, Advertising, Cross-Device, etc.
Role-Specific Tasks
UX Research Project Leader
I led UX Research for the Identity HaTS creation, which included: developing the overall methodology we would use including sample size calculations; coordinating with different stakeholders (Product Management, Engineering, Design, On-Device Surveys, Data Science, Legal, Localization, Googlers from other departments for survey translation double-checking, other UX Researchers); and ensuring that all tasks for the survey setup are done and documentation is completed.
Research Study Creation and Planning up to Launch
I created the research plan and selected the methodology to use for the study and analysis, which included reviewing white papers, similar studies from other Google teams and those outside of Google, survey creation and localization best practices, and internal YouTube survey launch documents and requirements.
YouTube On-Product HaTS and Data Science Team Reviews
Launching a survey within the YouTube app on TV UI itself is rare (usually surveys are technically outside of the product UI, as a separate screen with only the survey shown on it), and a survey with a large sample size needed specific approval from the team that runs on-product HaTS (who were also in charge of any on-product survey launches). I ran multiple meetings with the team to ensure that our method was mathematically sound, fit within YouTube’s on-product survey guidelines, and was cleared for launch without impacting other planned on-product experiments. The data science team was tapped to double check the work and provide guidance on the launch, including the different data points that YouTube logs which can be used to target specific user types.
Product Management Collaboration
I partnered with the Product Manager for the Identity team, who provided the buy-in support, provided MAU metrics for signed out users by market, and helped provide guidance on which markets to combine and trade off according to YouTube’s business and product goals when the mathematical calculations made some markets untenable to survey on their own. I also worked with them to understand specific device requirements, and pull data from previous on-device surveys to understand the potential survey response rate I needed to calculate the target sample size range.
Engineering Collaboration
With the Engineering team, I worked with the head of engineering for Identity, along with front end and backend engineers to understand what needed to be changed with the current YouTube HaTS UI to ensure we could launch the survey as intended, they had the correct localized survey content, new UI designs, and the specific guidance on which markets and types of user devices to target. Additionally, since a user interacting with the survey could put them into a 30 day quarantine which would negatively impact an important YouTube KPI, I needed to work with the engineer to make sure the interaction button was relabeled and hooked up correctly in the backend to circumvent the quarantine. The multi-select option for the survey also didn’t exist yet, so I worked with the team to have that built for the first time.
Legal Review and Approvals Coordination
Since the survey would be launched globally direct to signed out users’ TV devices, the survey questions and responses needed to go through several rounds of legal reviews to make sure the survey met YouTube’s legal requirements for surveys.
YouTube App on TV Design System Integration
The questions and answers for the survey needed to fit within the YouTube app on TV UI, which had a specific number of characters per line, and depending on the language, some characters were larger in size than others. I coordinated with the UX Designer in charge of the design system and I worked directly within the Figma file to test all of the survey questions and responses in different languages to see if they fit without being cut off.
Localization Team Contractor Management
The survey was too high-stakes and had specific requirements to simply put the questions and answers through Google Translate and launch, so I engaged Google’s internal Localization team to do translations, with native-speaking Googlers from other teams who would double-check the work. When we engaged the team, each language was assigned a different contractor for me to work with. If the text didn’t work (either the text was out of date with current ways of speaking, wasn’t at the correct reading level, didn’t fit the UI requirements, etc.), I would either go back to the Localization team for revisions or ask native-speaking Googlers from other teams to revise the text.
UX Researcher Collaboration and Transition Documents Creation
Since the survey launch ran into an end of the year code freeze which lasted past my contract time, but I had completed all of the planning necessary for the teams to move forward with the launch, I created transition documents for the remaining UX researcher to use to carry the project forward. This included a document for the engineering team to follow to ensure the survey appeared correctly in the YouTube app on TV UI, and was also sent to the correct types of accounts and devices. I also created documents for any other researcher at YouTube who wanted to launch an on-device survey to use, which included every decision I made, links to every document I reviewed and used to drive my choices, names of the different Google departments I worked with and for which part, and the method to use to launch, monitor, and interpret the survey findings. In addition, I also created a research findings slide deck template with some of the sides prefilled to make the transition easier for the UX researcher after findings were returned.